
Aerial view of emerald terraced rice paddies curving along a mountainside, flooded fields reflecting pale sky with a single thread of cloud shadow crossing the frame
Climate Risk Advisory

The climate has a position on your portfolio. Do you have one on the climate?

We translate satellite data, flood models, and wildfire probability into boardroom-ready risk assessments — before the weather turns.

2024 Global Losses

$368B

Attributed to extreme weather events

U.S. Billion-Dollar Events

27 events

In 2024 — second highest on record

Risk Threshold

1.5°C

Global temps surpassed in 2024 — hottest year on record
Scroll
Spring · Compound Flooding · River Systems · Coastal Surge · Infrastructure Bonds ·Spring · Compound Flooding · River Systems · Coastal Surge · Infrastructure Bonds ·Spring · Compound Flooding · River Systems · Coastal Surge · Infrastructure Bonds ·Spring · Compound Flooding · River Systems · Coastal Surge · Infrastructure Bonds ·Spring · Compound Flooding · River Systems · Coastal Surge · Infrastructure Bonds ·Spring · Compound Flooding · River Systems · Coastal Surge · Infrastructure Bonds ·Spring · Compound Flooding · River Systems · Coastal Surge · Infrastructure Bonds ·Spring · Compound Flooding · River Systems · Coastal Surge · Infrastructure Bonds ·
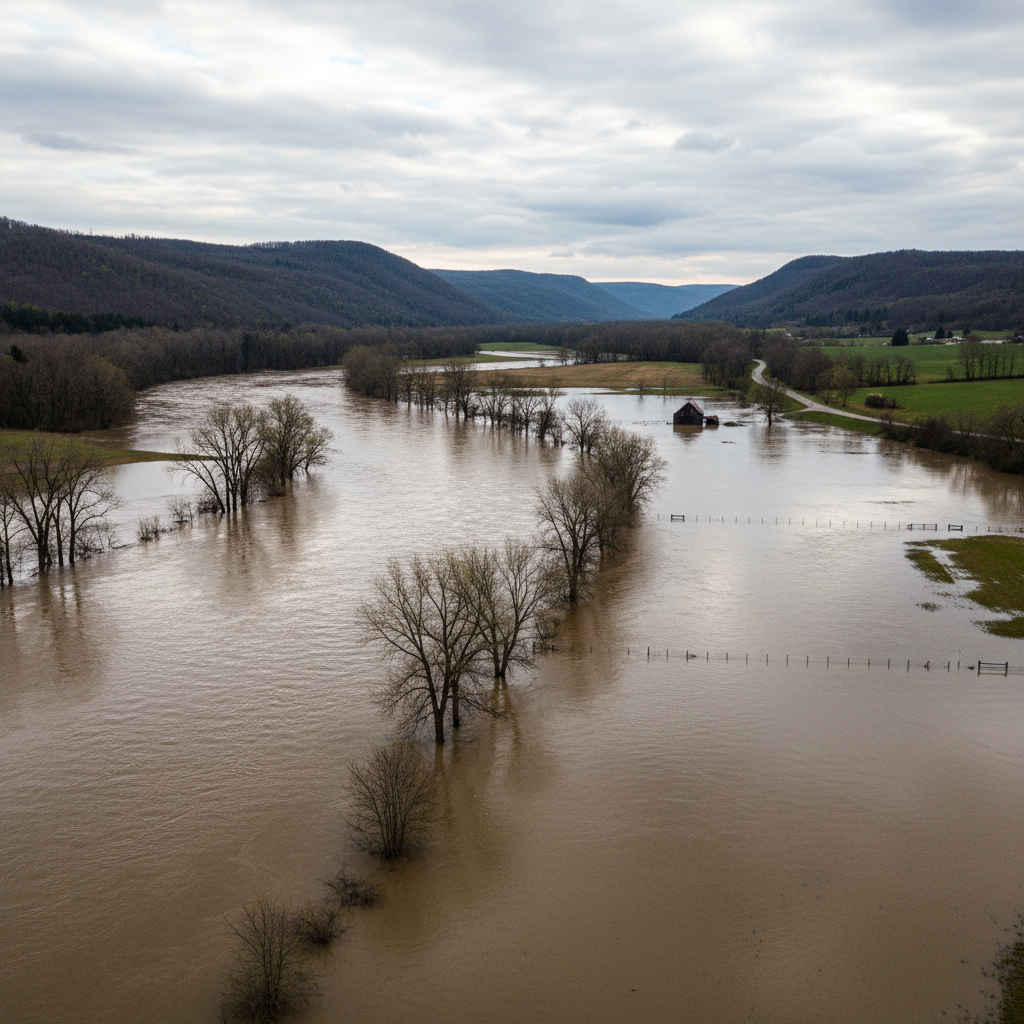
Flooded valley with submerged trees and brown swollen river water spreading across agricultural land in spring

Spring 2024

$182.7B

Total U.S. climate disaster cost

Chapter I · Spring

Compound flooding is no longer a tail risk. It is the base case.

87% of IEA member countries already carry medium or high flood exposure. The Fifth National Climate Assessment confirms that simultaneous extreme events — river flooding coinciding with storm surge — are accelerating along U.S. coastlines. For infrastructure bondholders, the twenty-year rainfall projection has become a credit variable.

$1.4T

U.S. disaster costs, 2015–2024 (190 events)

20M+

People displaced by floods and storms annually since 2008

"Medium confidence that compound flooding probability has increased in some locations, including along the U.S. coastline."— IPCC AR6

High exposure: Gulf Coast, Atlantic Seaboard, Mississippi Delta
Summer · Western Wildfire · Fire Weather Index · Asset Impairment · IPCC High Confidence ·Summer · Western Wildfire · Fire Weather Index · Asset Impairment · IPCC High Confidence ·Summer · Western Wildfire · Fire Weather Index · Asset Impairment · IPCC High Confidence ·Summer · Western Wildfire · Fire Weather Index · Asset Impairment · IPCC High Confidence ·Summer · Western Wildfire · Fire Weather Index · Asset Impairment · IPCC High Confidence ·Summer · Western Wildfire · Fire Weather Index · Asset Impairment · IPCC High Confidence ·Summer · Western Wildfire · Fire Weather Index · Asset Impairment · IPCC High Confidence ·Summer · Western Wildfire · Fire Weather Index · Asset Impairment · IPCC High Confidence ·
Chapter II · Summer

Fire weather conditions will become more frequent. The IPCC gives this high confidence.

The western wildfire season now extends from June through November. California, Oregon, Washington, Idaho, Montana, and Colorado face enhanced risk for weeks at a time. For real estate portfolios with exposure in these zones, insurability is no longer a given — it is a quarterly variable.

$90B+

Western wildfire damage, 2017–2021 (2024 dollars)

40%

World's land area exposed to increasingly severe drought

"High confidence that fire weather conditions will become more frequent at higher levels of global warming."— IPCC AR6
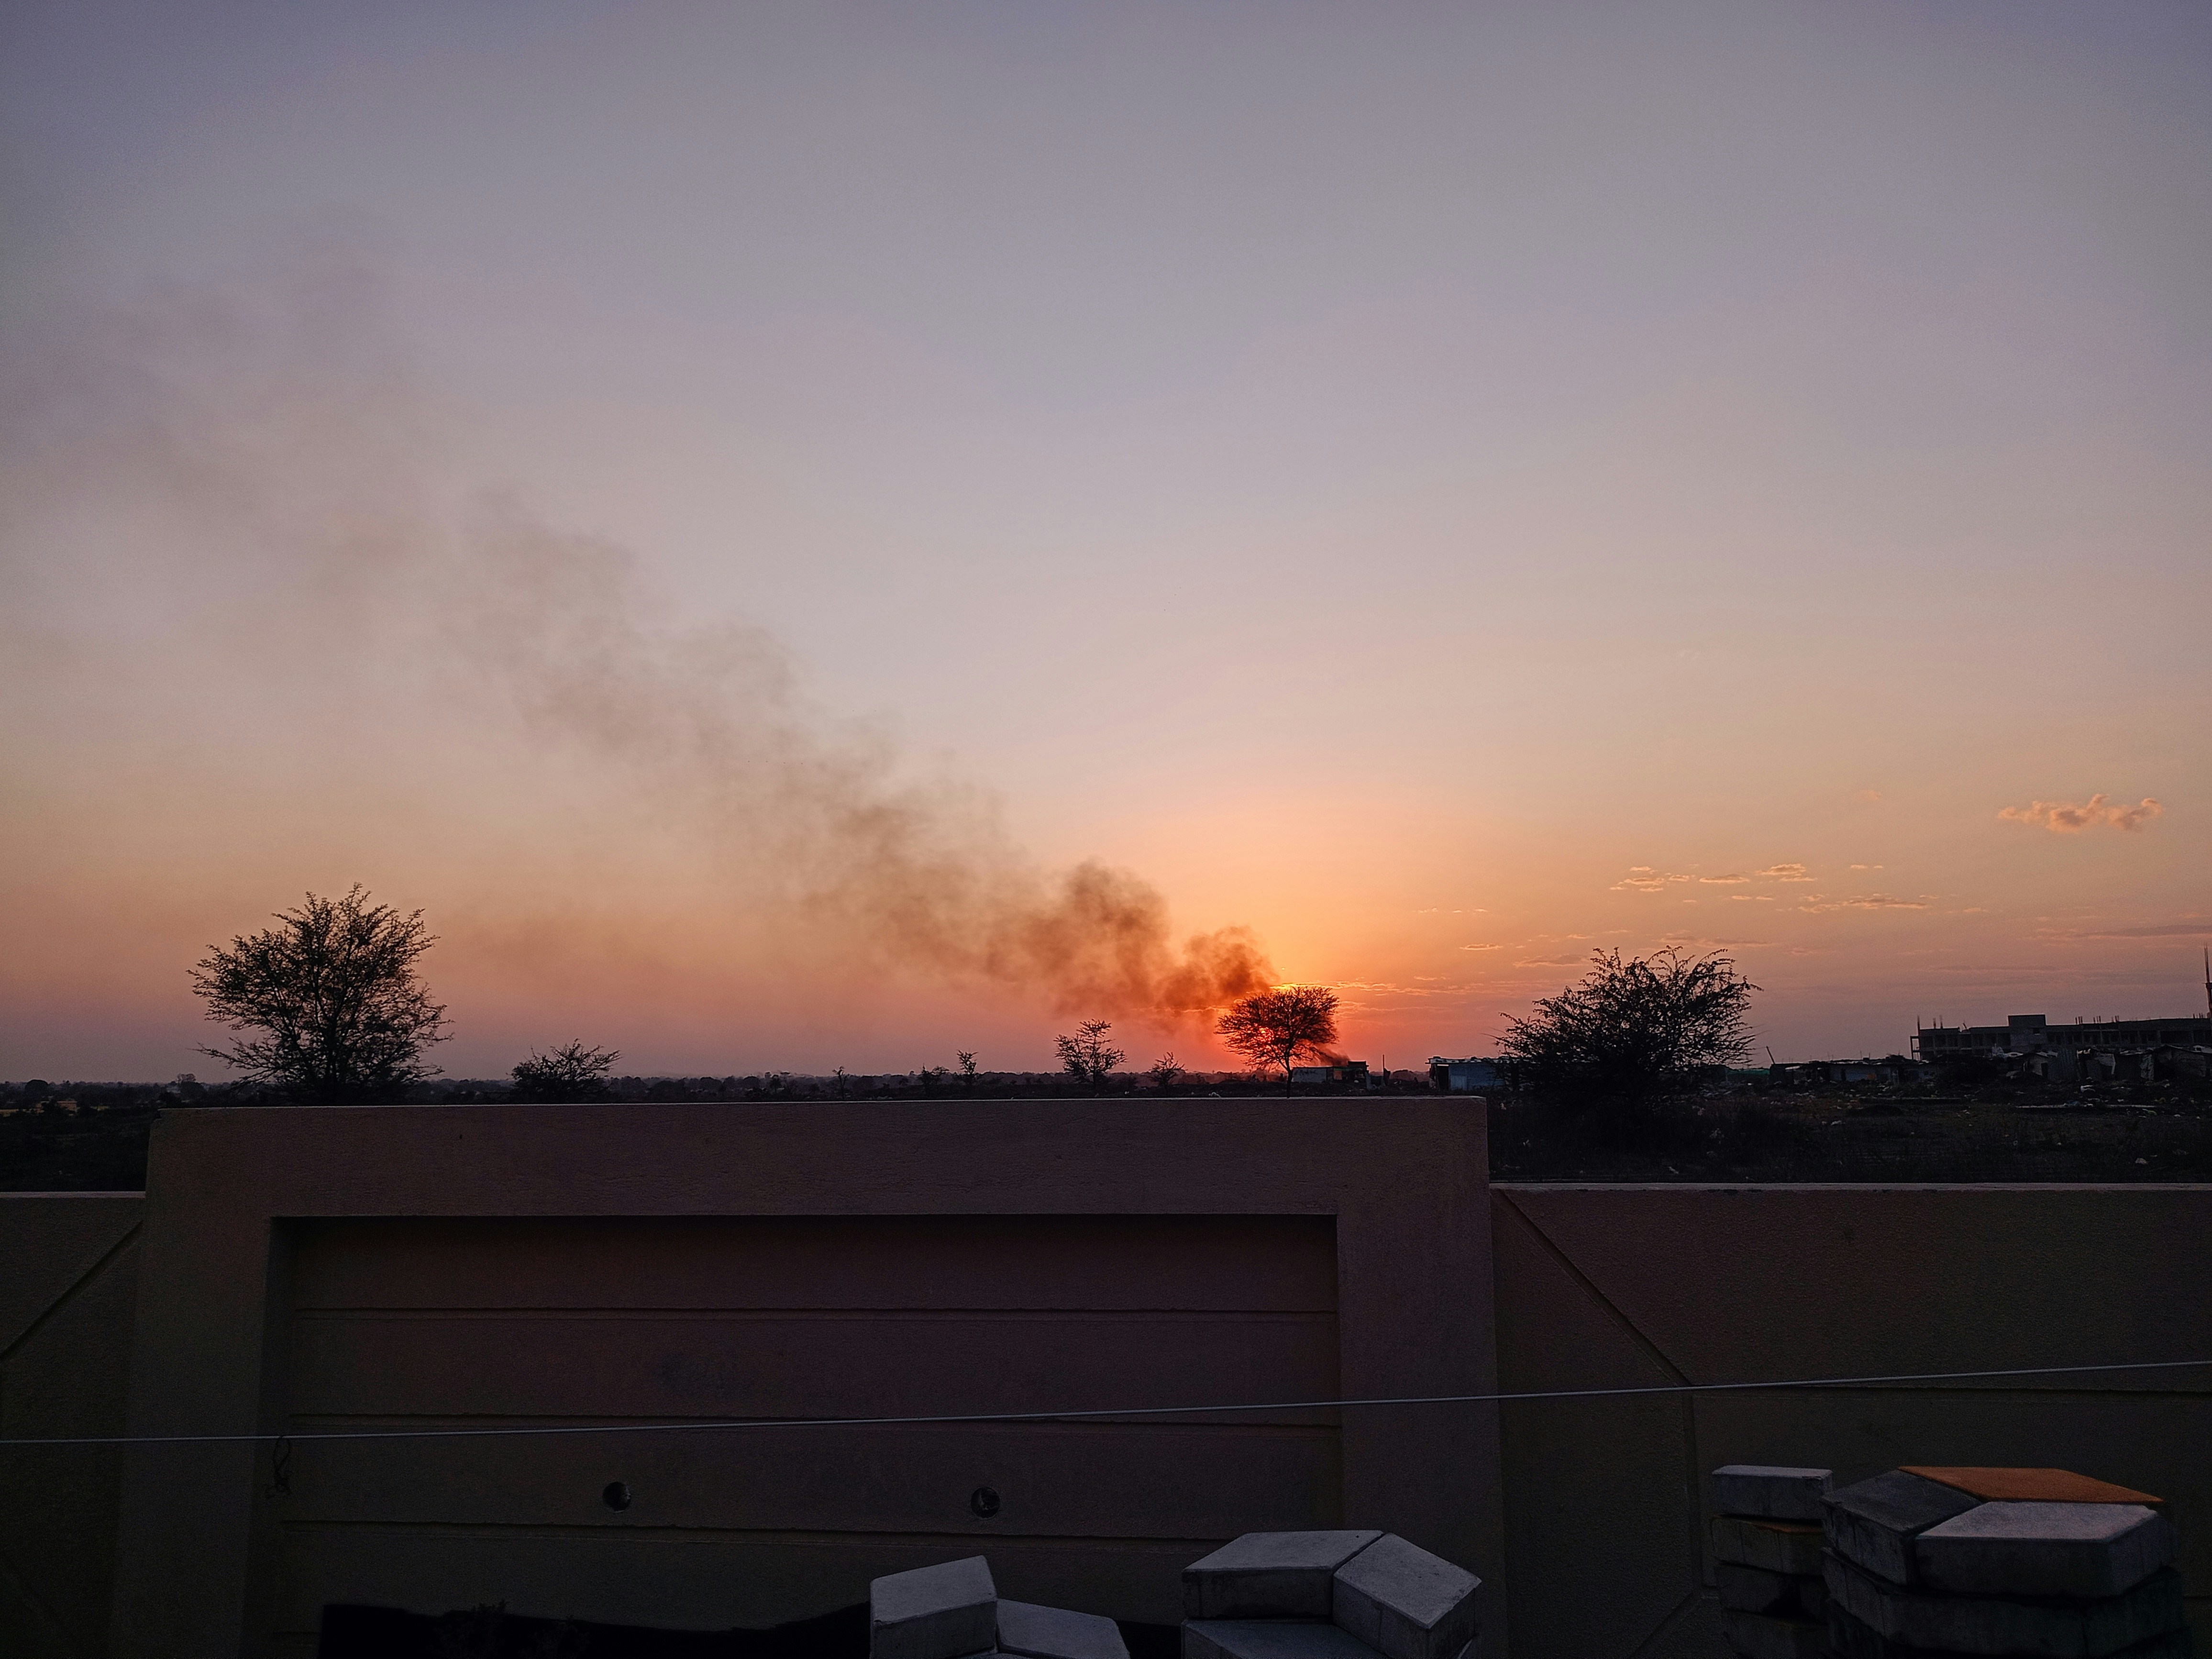
High exposure: CA, OR, WA, ID, MT, CO — Sep–Nov peak season
Dense wildfire smoke rising from burning forest hillside in the western United States, orange sky and silhouetted trees

EBITDA Risk by 2050

−25%

Projected reduction for exposed portfolios
Autumn · Atlantic Hurricane Season · Storm Surge · Coverage Repricing · Named Storms ·Autumn · Atlantic Hurricane Season · Storm Surge · Coverage Repricing · Named Storms ·Autumn · Atlantic Hurricane Season · Storm Surge · Coverage Repricing · Named Storms ·Autumn · Atlantic Hurricane Season · Storm Surge · Coverage Repricing · Named Storms ·Autumn · Atlantic Hurricane Season · Storm Surge · Coverage Repricing · Named Storms ·Autumn · Atlantic Hurricane Season · Storm Surge · Coverage Repricing · Named Storms ·Autumn · Atlantic Hurricane Season · Storm Surge · Coverage Repricing · Named Storms ·Autumn · Atlantic Hurricane Season · Storm Surge · Coverage Repricing · Named Storms ·
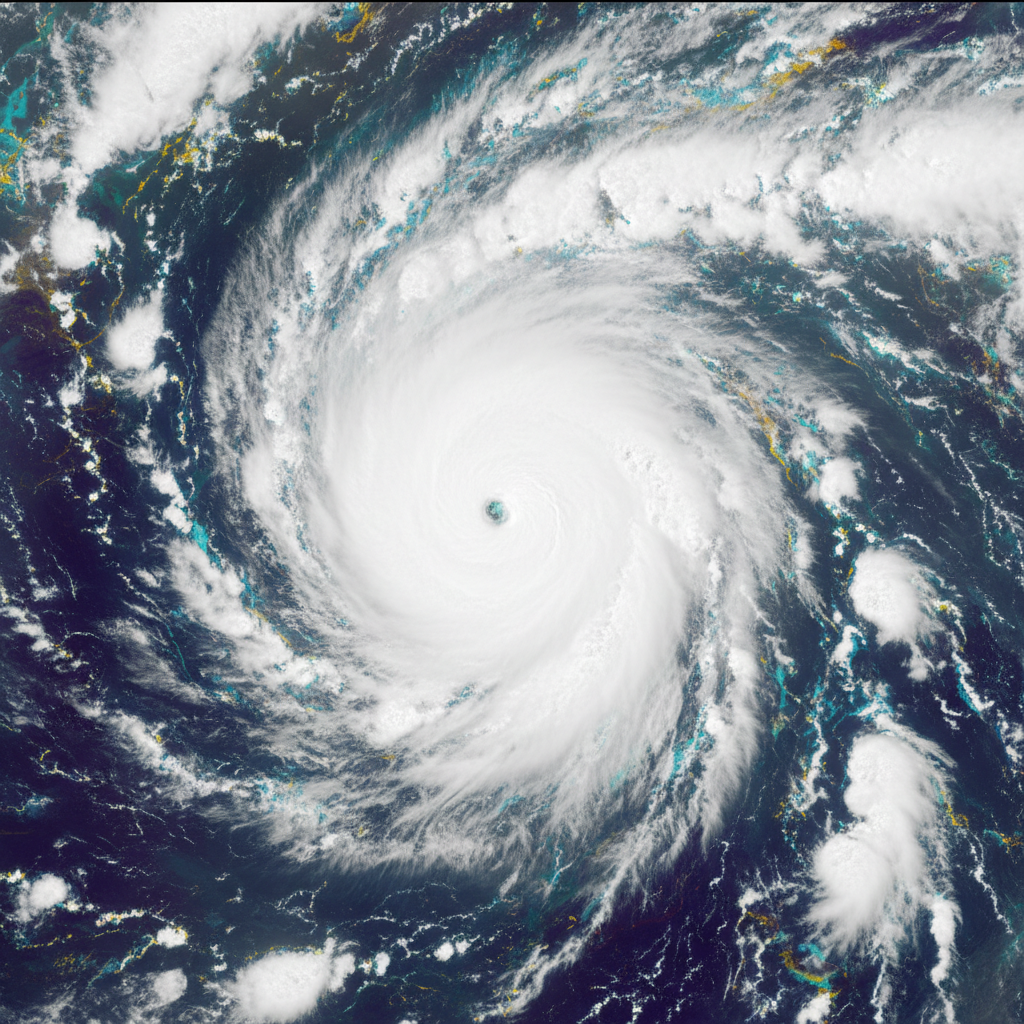
Satellite view of a large Atlantic hurricane spiral with dense white cloud bands and a visible eye wall over dark ocean water

Hurricane Milton, 2024

$34.3B

Category 3 landfall near Tampa, FL

Chapter III · Autumn

Eleven hurricanes. Five U.S. landfalls. One repricing event for coastal real estate.

The 2024 Atlantic season tied 1995 for fifth highest storm count on record. Hurricane Helene — seventh-most-costly Atlantic hurricane in history — delivered 15 feet of storm surge along the Big Bend coast and 30+ inches of rainfall across western North Carolina. For underwriters, the question is no longer whether to reprice. It is how fast.

2024 U.S. Landfalling Hurricanes

Hurricane Helene

Big Bend, FL — 7th costliest Atlantic storm on record

Record

Hurricane Milton

Tampa, FL — Category 3 landfall Oct 9, 2024

$34.3B

Hurricane Beryl

Texas Gulf Coast — earliest Category 5 on record

Significant
11 storms

Atlantic hurricanes in 2024 — tied for 5th highest on record

15ft

Storm surge, Big Bend coast — Helene landfall

High exposure: Gulf Coast, Tampa Bay, Carolinas, South Florida
Winter · Compound Extremes · Infrastructure Freeze · Scenario Analysis · Portfolio Stress Testing ·Winter · Compound Extremes · Infrastructure Freeze · Scenario Analysis · Portfolio Stress Testing ·Winter · Compound Extremes · Infrastructure Freeze · Scenario Analysis · Portfolio Stress Testing ·Winter · Compound Extremes · Infrastructure Freeze · Scenario Analysis · Portfolio Stress Testing ·Winter · Compound Extremes · Infrastructure Freeze · Scenario Analysis · Portfolio Stress Testing ·Winter · Compound Extremes · Infrastructure Freeze · Scenario Analysis · Portfolio Stress Testing ·Winter · Compound Extremes · Infrastructure Freeze · Scenario Analysis · Portfolio Stress Testing ·Winter · Compound Extremes · Infrastructure Freeze · Scenario Analysis · Portfolio Stress Testing ·
Chapter IV · Winter

The year has completed its cycle. The question is now unavoidable.

Compound extremes — disasters occurring simultaneously across multiple locations — are accelerating. Climate-related losses have surged from $12 billion annually in 1980 to nearly $120 billion today. The climate consulting market is growing at 10.21% annually because the cost of not knowing has become quantifiable.

$2.9T+

U.S. disaster costs since 1980 (403 events)

$120B

Annual climate losses today vs. $12B in 1980

Market Context

10.21%CAGR — climate consulting market

Financial services leads at 12.85% annual growth as prudential supervisors embed climate risk into capital frameworks. Risk Assessment & Scenario Analysis holds 22.95% market share in 2025.

40% of U.S. GDP exposed to climate-related land use risk
Frozen river with ice formations and snow-covered banks in winter, bare trees silhouetted against pale gray sky

14th Consecutive Year

10+ Events

Billion-dollar U.S. disasters — record streak

Forecast Advisory

Four seasons. Four vectors of loss. One question: what is your portfolio's position?

Our methodology page details how we quantify flood, wildfire, hurricane, and freeze exposure across real estate, insurance, and municipal bond portfolios — using satellite data, IPCC benchmarks, and proprietary loss models.

Data Sources

NOAA · IPCC · NCEI

Coverage

All 50 U.S. States

Scenario Horizon

5 · 20 · 50 Year

Engagement Model

Advisory · Retainer